Reliability Predictions: Parts Count, Part Stress, Pseudo Stress and Dormant
Reliability predictions are an important tool for making design trade-off decisions and estimating future system reliability. They are often used for making initial product support decisions such as how many spares are required to support fielded systems. Inaccurate predictions can lead to overly conservative designs and/or excessive spare parts procurement resulting in added life cycle cost (LCC). This article examines prediction approaches and trade-offs that should be considered between the accuracy of a prediction and the cost of performing the analysis when using MIL-HDBK-217 “Reliability Prediction of Electronic Equipment.”
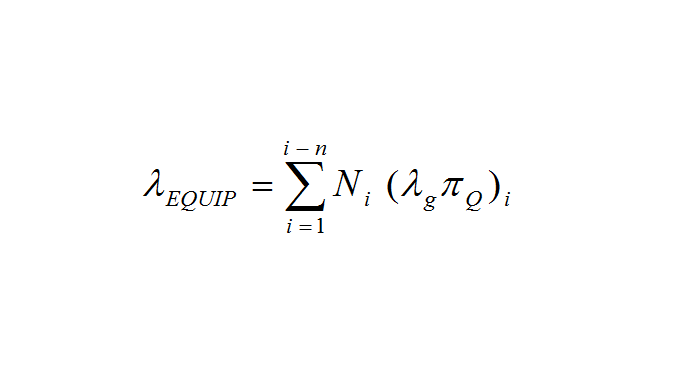
MIL-HDBK-217 is a worldwide standard for performing reliability predictions. The handbook includes a series of empirically based failure rate models covering virtually all electrical/electronic parts, covering 14 separate operational environments, such as ground fixed, airborne inhabited, etc. There are two primary prediction approaches: the Part Stress technique and the Parts Count technique. As the names imply, the Part Stress technique requires knowledge of the stress levels on each part to determine their failure rates, while the Parts Count technique assumes average stress levels as a means of providing an early design estimate of the failure rates. Typical factors used in determining a part’s failure rate include a temperature factor (πT), a power factor (πP), a power stress factor (πS), a quality factor (πQ), and an environmental factor (πE) in addition to the base failure rate (λb). For example, the failure rate model for a resistor is as follows:
λResistor = λb πT πP πS πQ πE
where λResistoris the estimated failure rate for the resistor in failures per million operating hours. The handbook does not include failure rate models for calculating dormant failure rates in non-operating conditions.
Ideally, the Parts Count technique is applied early in the design phase to determine that the predicted reliability is in the “ball park” with reliability requirements. As more detailed design information becomes available, such as detailed circuit schematics, the predictions should be refined to reflect actual applied component stress levels. This necessitates switching to the more detailed Part Stress reliability prediction methodology, which can result in significantly more labor hours for circuit analysis to compute the actual stress levels for each part application. Some companies simply use the Parts Count results as the final mean-time-between-failure (MTBF) estimate even though the results can be conservative because of the default stress levels assumed in the methodology, leading to sometimes costly from decisions such as the procurement of additional spare assemblies.
Many companies impose circuit design rules such as component derating levels; however, they do not receive the benefit of these policies in their Parts Count reliability predictions because of the higher default stress levels assumed by MIL-HDBK-217. The way to correct this is to either switch to the full Part Stress method or perform a “Pseudo Part Stress” analysis that assumes average stress levels based on company design policies.
| Derating is the practice of operating a component at a stress level below its rating in order to improve reliability. For example, if a 1/4 watt resistor is applied in a circuit so that it dissipates only 1/8 watt then it has a power derating of 50%. |
For example, if a company knows that carbon composition resistors are never operated at more than 25% of their rated power, a Pseudo Part Stress prediction would substitute the 25% stress level for the higher 50% Parts Count default stress level. Using this corporate knowledge can result in more accurate predictions without the significant cost of analyzing individual components that are known to be operated well within their ratings. While Pseudo Part Stress calculations can be performed manually (or in a spreadsheet), they can be tedious. One tool available for performing a Pseudo Part Stress prediction is the new Quanterion Automated Reliability Toolkit professional edition (QuART PRO). QuART PRO initially performs a basic MIL-HDBK-217 Parts Count prediction, but allows easily changing, on a global level, both electrical and thermal part stress levels for component categories so that they more closely reflect actual design stresses. Figure 1 shows this input for several capacitor categories.
 Figure 1 – QuART PRO Stress Inputs |
|
The benefit of the Pseudo Stress approach is an increase the prediction accuracy by reflecting known stress levels and/or company derating policy guidelines without the added costs associated with performing a complete Part Stress reliability prediction, as conceptually depicted by Figure 2. The Navy’s “Best Bang for the Buck, the Cost of Technical Processes” (NAVSO P-3691) indicates that a Part Stress prediction costs more than three times as much as a Part Count prediction, without considering the necessity for an electrical stress analysis that can change the increase from a factor of three to a factor of six.

Figure 2 – Reliability Predictions Options
Predicting Dormant Failure Rates
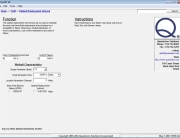
In the past, analysis techniques for determining reliability estimates for dormant or storage conditions relied on rules of thumb such as “the failure rate will be reduced by a ten-to-one factor” or “the failure rate expected is zero.” A more realistic estimate, based on MIL-HDBK-217 Parts Count failure rate predictions can be calculated by applying the conversion factors provided in the “Rome Laboratory Reliability Engineer’s Toolkit.” The Toolkit factors are based on RADC-TR-85-91, “Impact of Nonoperating Periods on Equipment Reliability”, and convert active failure rates by part type to passive or dormant conditions for seven operational scenarios, such as converting the reliability of an active airborne receiver to a captive carry dormant condition. QuART PRO implements these algorithms in the easy to use Parts Count reliability prediction module, shown in Figure 3. The analyst simply performs a MIL-HDBK-217 Parts Count analysis in the normal way and then picks the dormant and operating environments from drop down boxes, along with the percentage of time in each environment. Because all time is now accounted for, the resulting failure rate is in units of “failures per calendar time,” not simply failures per operating hours. For more information or to purchase, Click here.

Figure 3 – QuART PRO Dormant Failure Calculation


